Sea Level Rise Mapping and Ethics
GIS technologies are allowing researchers ways to better understand the impacts of climate change and its related issues. One such issue is sea level rise. As sea levels continue to rise more people are at risk and geospatial mapping may be able to help.
What is Sea Level Rise?
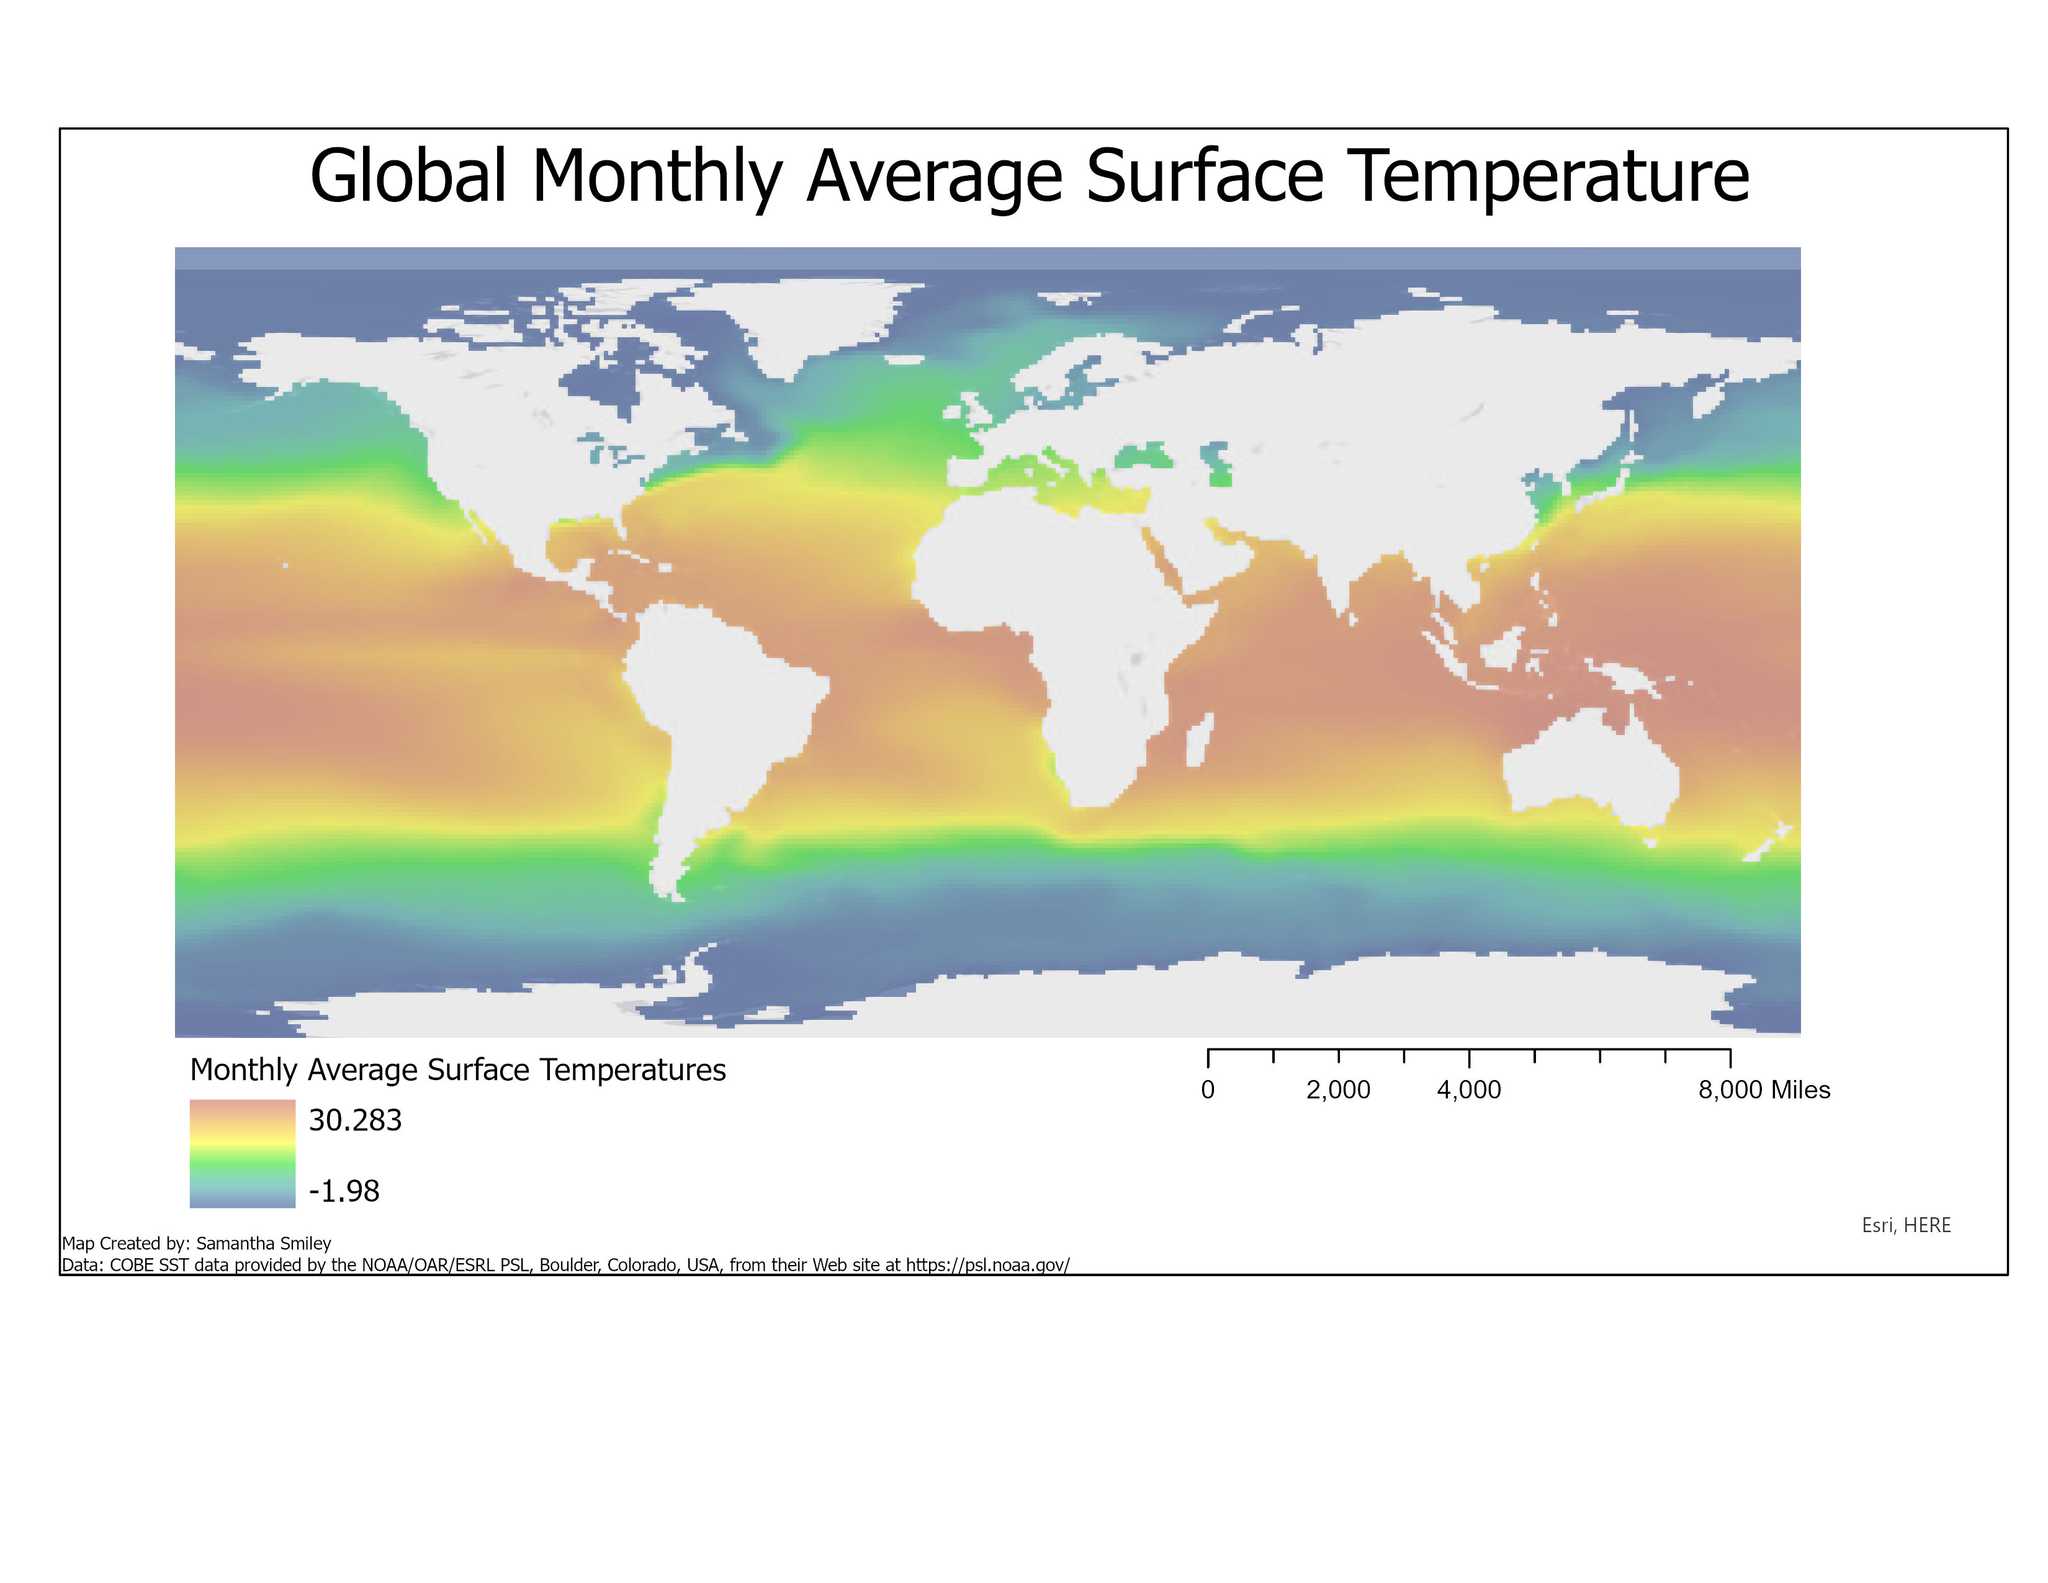
Sea level rise is increased ocean levels due to melting of global ice stores associated with climate change. As average temperatures continue to increase the rate in which global ice melts hastens. Some research has shown that sea levels have been rising at a rate of 3.0 mm a−1 or 3.2 mm a−1 since the 1990s (Gehrels 2016). The map below shows monthly global average sea surface temperatures using NOAA data processed by Ishii et al. (2005). The increased sea levels leave many communities at risk.

What are the impacts?
Estimates of how high sea levels rise vary by study. One study estimates 18–48 cm of rise by 2050, and 50–140 cm by 2100 (Cooper et al. 2013). Another study estimates as high as 1.8 meters by 2100 (Hauer et al. 2016). With these projections of sea level rise, it is believed that as many as 16 million people could be effected in the United States (Hauer et al. 2016). When looking at a global scale, approximately 600 million reside at or close to sea level (McGranahan et al 2007). Sea level rise will lead to increased intensity of storm surges, flooding, and other damage to coastal areas.
Nearly all coastal ecosystems systems will be effected by sea level rise in particular costal wetlands and regions with high human development (Day and Rybczyk 2019). Costal wetlands habitats such as mangroves will can degrade increased inundation and storm surges (Fonteh et al. 2009) . Nearly all coastal ecosystems systems will be effected by sea level rise. , most importantly coastal wetlands and human development. This damage will effect particular costal communities more than others and displace millions from there homes.
GIS in Sea Level Rise Research and Management
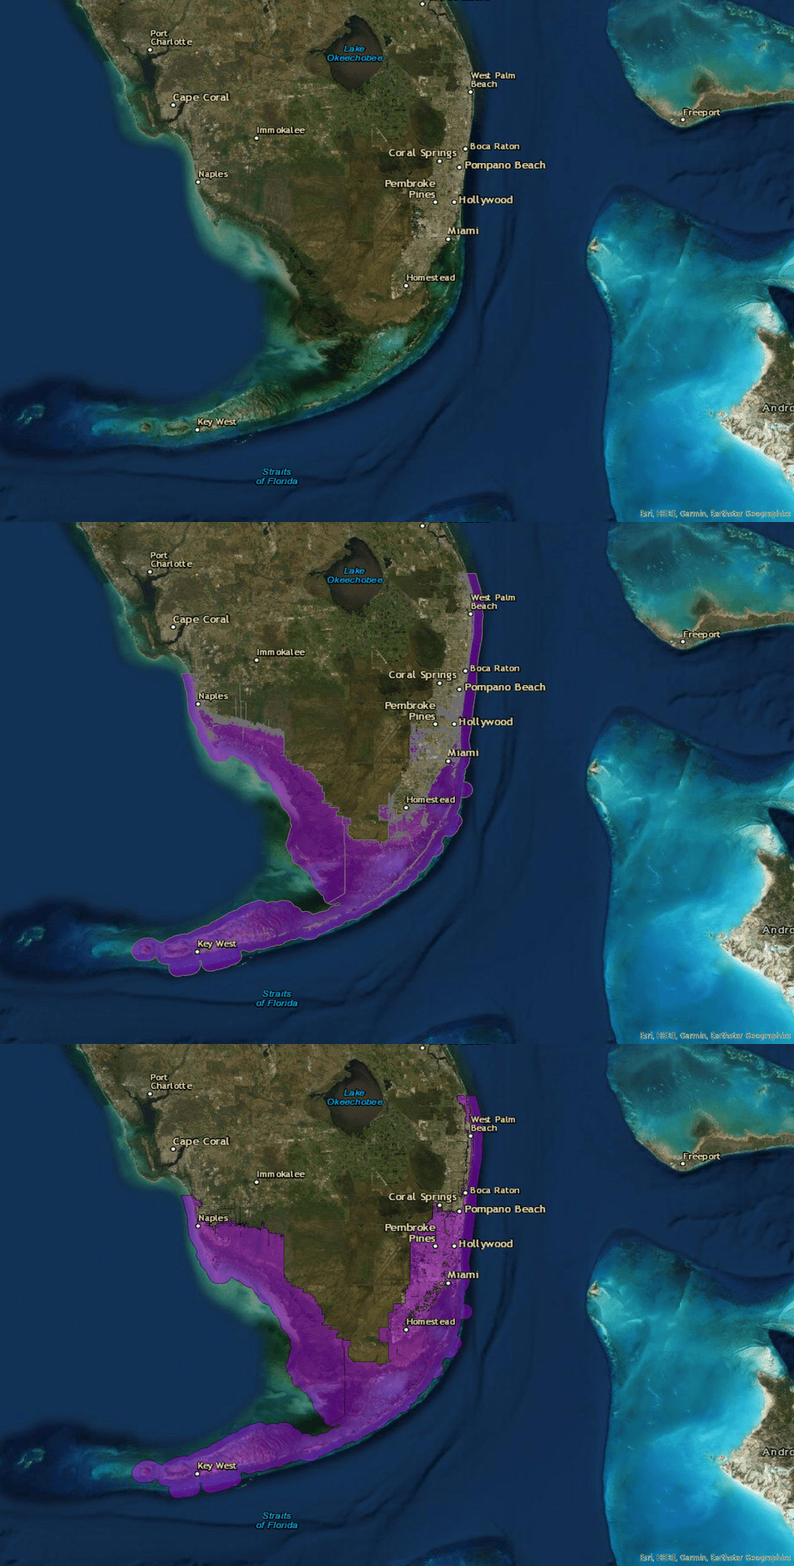
GIS and related technologies are being used to help map sea level rise. This includes general mapping of inundation regions most impacted by sea level rise. Below is a Inundation map of the Miami area that I created below using NOAA Sea Level Rise Data. These data sources can be used to create vulnerability assessments to understand risks and potential damage associated with sea level rise and storm surges for costal communities.

Ethical Implications
As GIS and technology is used to research and plan for sea level rise. Climate change research is a ever changing and improving field. The technologies used to research climate change sea level rise are also advancing and changing. Sea level rise assessments relies on a broad range of data sources complex factors can contributes to uncertainties in forecasting and predicating long‐term impacts from sea level rise (Gutierrez et al. 2011).This means the maps and projections made for sea level rise can have various levels of error depending on what data sources are used. This uncertain data coupled with the human factors means mapping and forecasting can be difficult (Bryravan and Rajan 2010).This creates a ethical dilemma of what should be reported to the public and under what levels of certainty to provide the most accurate information to insure the safety of individuals.
These scenarios also have social and political components. social and ethical assessments must be made currently not post hoc. These technologies and scenarios should consider the social and political questions about purpose, ownership, control, and responsibility in relation to mapping sea level rise (Corner and Pidgeon 2010). This does not mean that mapping should not be done. It does however mean researchers and GIS professionals have to understand the role they play and must ask questions.
Role for GIS Professionals
When GIS professionals work on climate change and sea level mapping projects and projections they need to consider the social and political questions related to the topic. GIS professionals must consider internalist judgements and also consider externalist judgements as outlined in Compton (1995). Without assessing these topics, ethical dilemmas may be missed in the process of the project. Below are example questions GIS professionals should be asking themselves at the start of a project.
Questions include:
What is the purpose of the project or map? Is this project or map needed? Who owns it the map? Who is funding the project? Who will be responsible if things go wrong or predictions are inaccurate?
